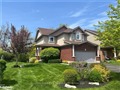
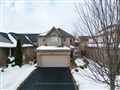
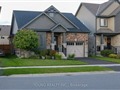
53 Mclean Ave
$1,101,405
Comparative Market Analysis
May 22, 2025
NOT AN ACTIVE LISTING
Historical Performance
| Period | $ Change | % Change |
| 1 Day | +$371 | +0.034% |
| 7 Days | +$309 | +0.028% |
| 30 Days | -$1,995 | -0.181% |
| 3 Months | -$4,387 | -0.397% |
| 6 Months | +$14.8k | +1.36% |
| 1 Year | +$8,189 | +0.749% |
| 3 Years | +$224k | +25.5% |
| 5 Years | +$366k | +49.8% |
| 10 Years | +$647k | +142% |
List My Property
Real Estate Statistics
Financing Solutions
AS SEEN ON


Are You a Licensed Real Estate Agent or Broker?