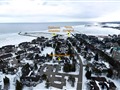
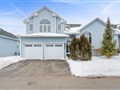
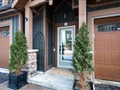
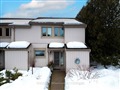
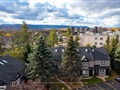
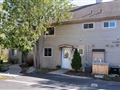
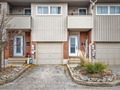
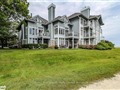
20 Montclair Mews
$783,288
Comparative Market Analysis
Jul 7, 2025
NOT AN ACTIVE LISTING
Historical Performance
| Period | $ Change | % Change |
| 1 Day | +$310 | +0.040% |
| 7 Days | +$523 | +0.067% |
| 30 Days | -$615 | -0.078% |
| 3 Months | -$1,869 | -0.238% |
| 6 Months | +$10.7k | +1.39% |
| 1 Year | -$32.0k | -3.92% |
| 3 Years | +$199k | +34.1% |
| 5 Years | +$291k | +59.0% |
| 10 Years | +$476k | +155% |
List My Property
Real Estate Statistics
Financing Solutions
Browsing History
30 Mair Mills Dr, Collingwood
6 seconds ago
16 Homestead Dr, Collingwood
10 seconds ago
AS SEEN ON


Are You a Licensed Real Estate Agent or Broker?